
Some time ago, I was asked by Claire, the BI director of a European retail company, let’s call it RetailMax, to help manage the Power BI adoption strategy. The director had recently joined the company and had big ambitions for BI development.
background
General info:
- RetailMax holding company trades in electronics equipment, books, newspapers, tickets, and music.
- It was created a few years ago as a merger of 2 distinct companies. It still operates under two different brands in the classic land-based and online business.
- It operates in Europe with more than 500 stores.
IT/Data Info:
- In RetailMax there are:
- 2 systems ERP (MS Dynamics and Proginov) – it’s post-merger legacy.
- 2 WMS systems
- 2 on-Prem BI Solutions:
- Genio + Oracle + MicroStrategy
- MS SQL Server + RS + SSIS
- All the critical for operations infrastructure is On-Prem based.
- The data infrastructure is based mainly on Azure:
- ADF
- AAS
- Synapse Dedicated Pool
- Power BI
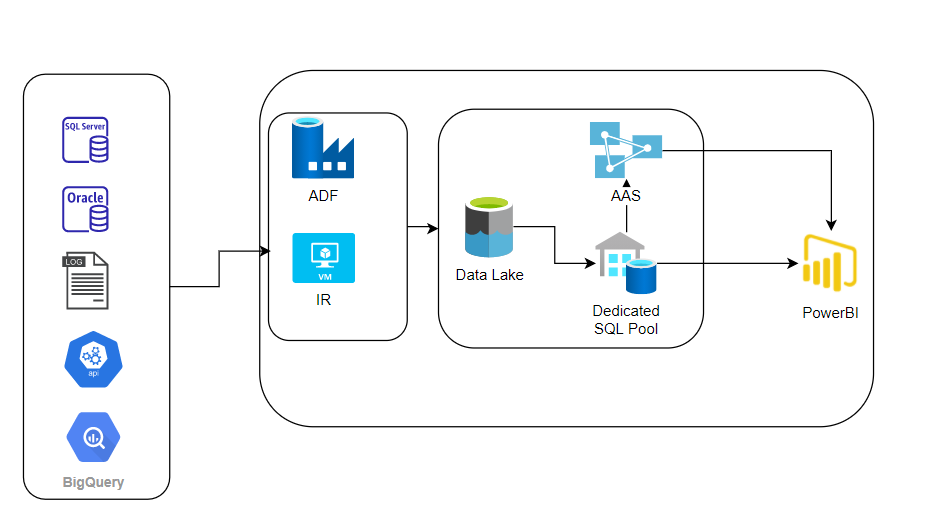
The simplified overview of the data architecture
Organizational info:
1. The lack of CIO/CDO in the holding
2. Low retention of Head of Data/BI
3. Mixed BI approach:
– Central BI department responsible to handle the enterprise Data needs
– Departments hire the own BI developers/PBI Analyst
– High self-service activities
4. The departments do not contribute to the budget of the Central BI Department
5. The documentation does not exist.
Claire’s challenges
Discussion with Claire, revealed the following biggest challenges to face:
- How to overcome the chaos in BI/Data solution?
- What are the top data products in the organization?
- How to increase the stability of the BI without increasing the budget on the infrastructure?
- How to reduce AAS/Synapse load?
Together we prepared the following action plan:
- Assessment of the current BI/Data Solution
- Identification of Quick Wins potential
- Establishing the long-term BI/Data roadmap and focusing on the key priorities.
Starting with the assessment, I divided it in the following chapters:
- Azure Architecture and Azure Governance overview
- Overview of the OnPrem solution (SQL SERVER + MicroStrategy)
- Overview of ETL/Synapse on Azure
- Overview of AAS models
- Overview of Power BI Service and Governance
- Overview of BI department processes and way of working
- Assessment results and Roadmap
In this article I’m focusing only on number 5: Overview of Power BI Service and Governance as this is the key one in this case study.
I’m always starting Power BI Assessment, with answering the following questions:
- What is the scale of use of Power BI?
– A different approach is required for an organization that uses thousands of reports and another for an organization that uses a few.
- What does the process of Power BI development look like?
– It allows you to quickly assess the maturity of your organization: (ticket-based organization vs COE-based) - What licenses does the organization use?
– What licenses are used, why such and not others, what the licensing process looks like – once again this information helps to assess the company’s maturity and cost-efficiency.
- What is the quality of existing solutions?
– A quick glimpse at data models and workspace configuration tells you a lot.
- How does the organization measure adoption of PBI?
– This is a crucial one: do we know what exactly we have in our Power BI stable? How many reports? What are the most important ones? Who are the users?
- How does the organization measure ROI from BI solutions?
They help me to calibrate the scope of the assessment and focus on the top priorities.
How do you find the needed information? You always have the similar sources of the information:
- Interviews with the principal actors (Developers, Architects, Project Managers, Business Users)
- Power BI Service
- Azure Devops/Jira/another backlog/PM tool
- Documentation
In this case, a quick look at the Power BI service revealed that RetailMax is a classic example of an organization where the need for information is growing much faster than the ability of the Data/BI department to deliver BI solutions. There was chaos in both the naming conventions for PBI objects and access – it was impossible to know who had access to what data. Dozen of “Weekly Sales Reports”, reports with suffixes such as “old”, “final” and no separation between DEV and Prod environments on workspace level were clear signals of the absence of Governance processes. Interviews with selected users revealed a performance problem and a lack of confidence in the data. The few datasets that were reviewed indicated a need to strengthen RetailMax’s data modelling capabilities.
But the quick glimpse was not enough, there were thousands of reports and thousands of users…
The need for a clean-up was obvious, however how shall you start it? You simply cannot randomly decide to merge all the reports containing “weekly sales” in their names. To start, you must know the answers to these two questions:
- Who are the business owners of the reports?
- Which reports should be laid off?
The first one streamlines all the refactor process, and the second one makes your picture cleaner: it’s easier to handle several hundreds reports than several thousands.
You can easily add the additional questions, to your list:
- How many PBI reports do we have?
– How many are centralized and how many are self-service?
- Which of our reports is the most used?
– And which ones are not used at all?
- Who has access to the reports?
- What happens if I delete report ‘C’?
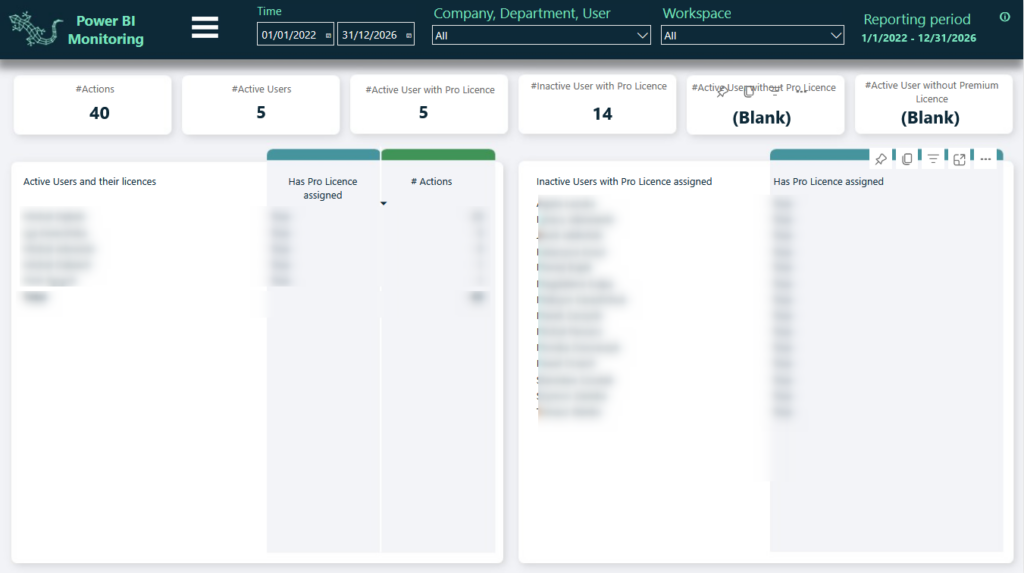
- Are all users who have been granted Power BI Pro or Premium per-user license active?
- Which datasets (semantic models) are impacting the most Synapse Dedicated Pool?
- What are the data sources of our datasets (semantic models) ?
Finding the answers to all these questions manually would have required hundreds of hours of analyzing the entire environment, so a solution was needed to automate this work. Fortunately, by downloading the necessary data via the Power BI Rest API and Graph API, the answers to the nagging questions were possible, all we had to do was download the data and process it accordingly – this is how Astral Owl was born.
Astral Owl
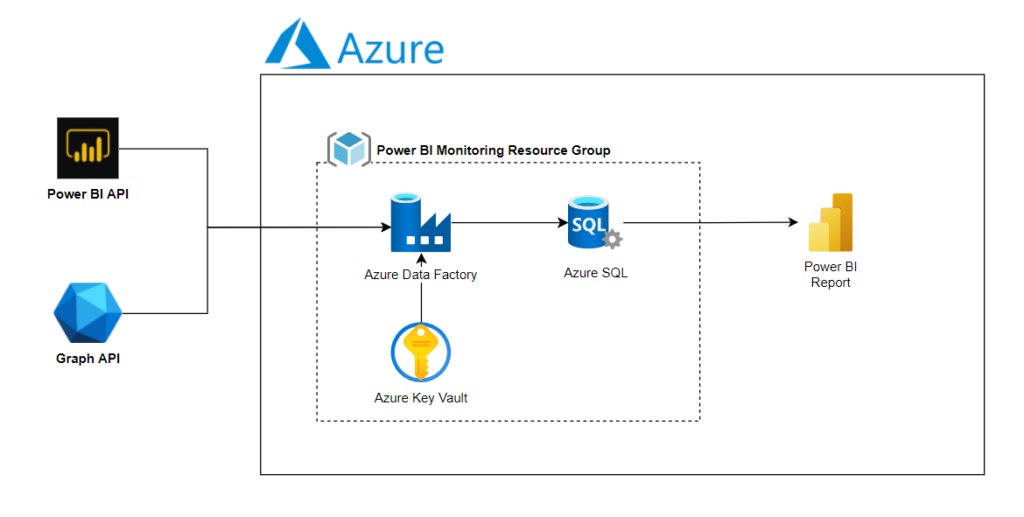
Power BI Monitoring Simplified Architecture
To put it simply Astral Owl captures all the data about Power BI usage through Power BI API, transforms the data into a nice star-schema model and displays the data through a Power BI Report.
All the necessary elements can be implemented within 1 Day.
Once Astral Owl PBI Monitoring solution is implemented you have access to the last 30 days of data (Power BI REST API does not allow to reach any further for the data) to run deeper analysis, you must accumulate the data. Together with Claire we decided that the 120 days would be enough to draw sufficient conclusions.
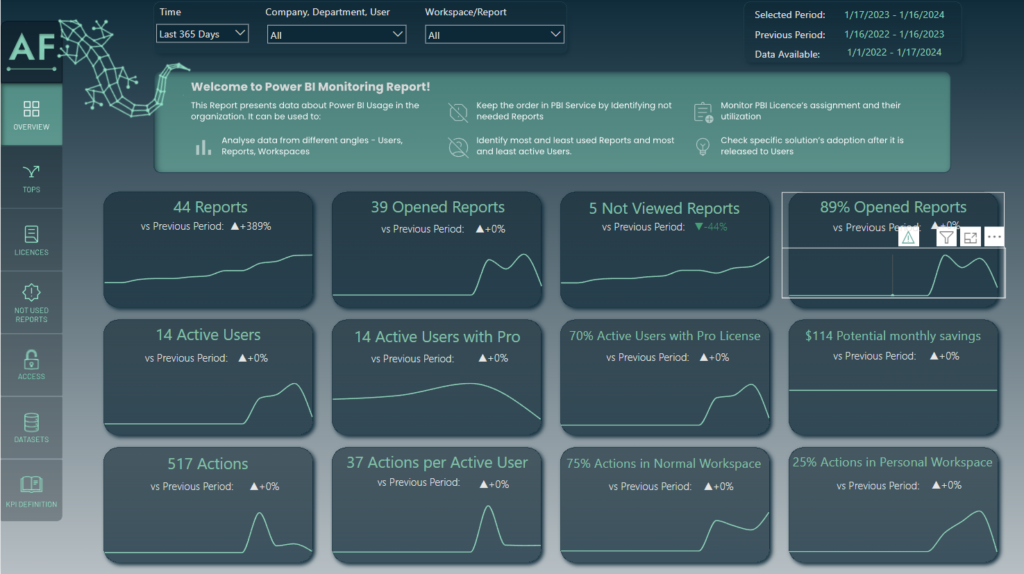
Thanks to Astral Owl we discovered:
- 5,5k Total reports
- 2,2k reports not used in the last 120 days
- 1,6k reports used less than 3 times in the last 120 days
- 1,1k active users with Pro license assigned.
- 212 active users with PPU license assigned.
- 653 in-active users with Pro license assigned.
- 41 in-active users with PPU license assigned.
- 78 active users without any license assigned.
- 1k Dataset refresh failures in the last 120 days
- 68% of users action were done in Personal Workspaces
Moreover, Astral Owl found out/confirmed:
- The most popular reports in the organisation were self service created, available on private workspace.
- No naming rules for objects in PBI Service
- Many repetitive reports
- No separation of semantic models and Power BI reports
- Access is granted mainly at user level
Quick Wins
We identified the following quick wins:
- Archiving the unused reports
- Optimization Power BI Licenses
- Identification and assignment of Business Owners to the reports
Archiving the unused reports
As we knew which reports were not used, we started with the PBI Service cleanup. This idea was immediately followed by two questions:
- How do we quickly remove 2,2k not-used reports?
- What if some reports are used only seasonally? (for example, for holiday season)
The answer to the first question is a script :). And the answer to the second question is also a script. Instead of removing these reports, we decided to move them to the archive on ADLS (here you have the link describing the technical solution, the part about using Selenium to go through all the personal workspaces is my favorite). In this way you can always bring back a report to PBI Service.
Archiving the reports also resulted in removing the datasets querying Synapse, which increased the overall DWH performance. Some of the workspaces became empty – these were also removed.
PBI License optimization
At the same time as we were cleaning up the PBI objects, we started to reassign licenses. 653 users had their PBI Pro license and 41 PPUs removed due to inactivity, while 78 active users received Power BI Pro licenses. Result: 65626.7 EUR was saved annually thanks to the implemented license management.
Business Owners Assignment
Once the initial clean-up was complete, we moved on to the next phase with Claire. Even after archiving 2.2k reports, we still had 3.3k to deal with, many of which were barely used. It was a classic example of long tail distribution. We decided to leave them alone for a while – more data needed to be collected to decide about potential archiving.
We focused on the most used to make a small change.
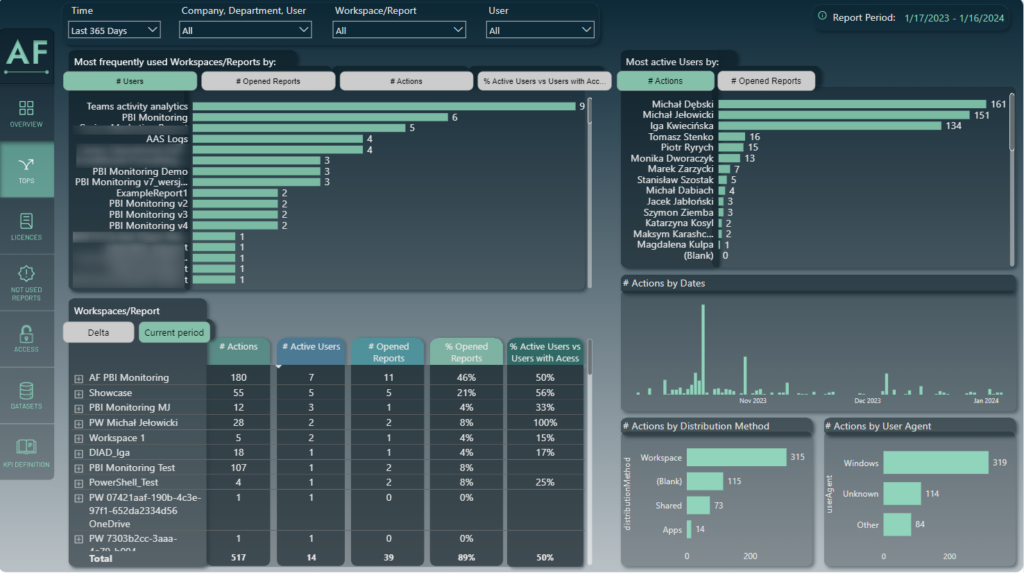
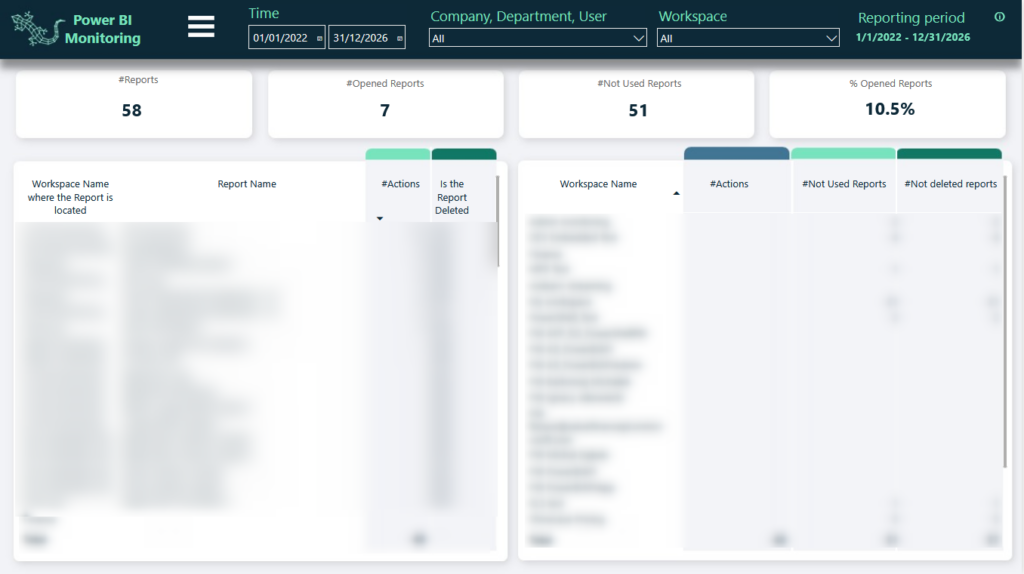
Most active Power BI Users
This report helped us identify the business owners of the reports; instead of shooting blanks across the organization, to random people, asking if they knew who cared about a particular report, we simply went to the most frequent users of the reports. We focused on the 300 top used reports (staringly their covered almost 80% of the users’ activities)
In 93% of cases, at least one of the top 5 users agreed to become the business owner of the report or named the right person. The insights provided by Astral Owl PBI Monitoring dramatically reduced the time it took to identify the business owners of the reports.
Quick Wins ROI
| Result | ROI | Calculation |
| PBI License Optimization | 65k€ annually | 12*(653-78)*9,40€ +12*41*18,70€ |
| Easier Access to Information | 132 MD annually | 733 [WAU ]* 5[MIN/WEEK] * 52 [WEEK] |
| Less tickets | 187 MD annually | 748[ticket] * 2[h/ticket] |
| Less queries on Synapse | 364 min elapsed time daily | Difference between the day before and after archiving the unused reports |
How to calculate the ROI?
- PBI License Optimization: the number unassigned licenses minus the number of newly assigned ones multiplied by the license cost.
- Easier Access to Information: we assumed 5 min per week spent less by a weekly active user at searching for the information. 5 min per week, multiplied by the number of weekly active users.
- Less tickets: there were 3740 tickets in JIRA related to Power BI reports in the last 12 months. According to the Pareto rule, 20% of the reports generated 80% of the tickets. We assumed that were cleaned up generated 20% of these tickets – 748. The average resolution time per ticket was 2h (source JIRA Tempo addon).
- Less queries on Synapse: Difference between the day before and after archiving the unused reports.
The value of the quick wins and Astral Owl, allowed Claire to:
- Get the trust of Executive Committee
- Securing the budget for subsequent phases of the project
- Get the tool to negotiate with the business and judge the priorities based on the data.
- Get the tool to measure the adoption of PBI reports and help to manage the governance.
Beyond the quick wins
What were the next steps after the initial quick wins included in the roadmap?
- Refactor of the key reports
– PBI Reports + underlying data + ETL using the new, metadata-based framework
- Centralization of the reports
– Get the most used reports built by the BU out of personal workspaces
– Put in place the process based on the clear criteria
- Clean up the almost un-used reports
– Put in in place the archiving process based on the actual usage of the reports
- Refactor of workspaces
- Streamlined security through the usage of AAD groups
- Integrating the Power BI Administrator Role to care about the quality of the platform and Power BI Adoption
- Change of the development process
– Clear development standards such as brandbook, standard design, KPI page, test phase
- Identification of Power BI Champions
– Bridging the gap between the central BI and the BU
That’s all for now 🙂 If you want to learn more about Astral Owl Power BI Monitoring or the transformation process, just drop me a message to start your journey.
0 Comments