
Hello!
In today’s article, I would like to talk about checking your most active users across the Power BI service with a real-life example.
Enjoy reading!
Agenda
- Assumptions
- PBI Monitoring Presentation
- Address Our Scenario
- Final Thoughts
Assumptions
How do you check if reports developed across your company are being used?
How do you track who is using your reports?
Are you tracking the most active departments/users?
Have you ever wondered who is performing what type of activities across the Power BI service?
To answer the above questions, let’s assume the following:
- The IT department proactively reaches out to other departments with a Power BI reporting proposal.
- Kate is a new Power BI developer working in the IT department.
- Kate’s main task is to propose, develop, and publish new marketing reports according to best practices and addressing current marketing department challenges.
- Although Kate has an initial list of marketing employees, it seems the list is not up to date. So, Kate needs to find out with whom to discuss report requirements and challenges.
PBI Monitoring Presentation
To address the above case, we will use the Power BI Monitoring tool built by my company, Astral Forest.
Let’s focus on the “Tops” page. It contains detailed information about users, reports, and workspaces.
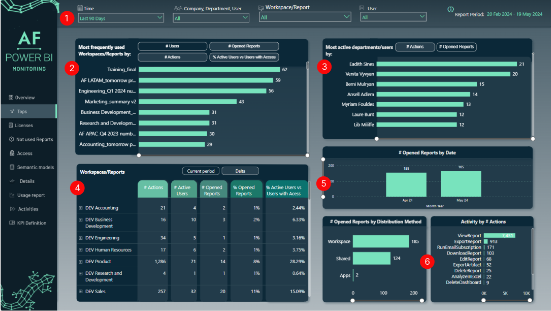
Picture 1: Tops page
(1) Filters
At the top of the page, you have several filters to select your data:
- Time – A slicer with relevant time periods based on today’s date and the last “xx” days. We always look at data from yesterday to have full-day data. So if today is 20 May 2024, “Last 7 days” will show 7 days from 12 May 2024 to 19 May 2024.
- Company, Department, User – Detailed selection of your company structure. This is useful when you want to focus on a specific group of users.
- Workspace/Report – A list of workspaces and reports attached to them.
- User – A list of users. This is a dynamic filter, containing only users who have actually performed some actions in the context specified by other filters.
(2) Most Frequently Used Workspaces / Reports By
Here, you can use a drill down/drill up functionality to navigate between the list of workspaces and reports. Also, analysis can be performed at different levels, depending on selection:
- # Users – The distinct number of users performing any action on a specific workspace/report.
- # Opened Reports – Shows the distinct number of reports opened from the workspace level. If you drill down to the report level and see a number higher than 1 per report, it means you have the same reports uploaded in different workspaces! This is another validation step you can take to check the health of the Power BI service.
- # Actions – The number of actions performed by departments/users related to workspaces or reports.
- % Active Users vs. Users with Access – The ratio of users performing actions versus all users with access to this particular workspace/report. This is a great measure to set up goals/targets for the Power BI reports’ life span. In a perfect world, it should always be 100%, but in reality, this can drop significantly. When you see a low percentage, you can investigate what’s going on with the actual Power BI content provided.
(3) Most Active Departments/Users By
As in the above example, you can use a drill down/drill up functionality to navigate between the list of workspaces and reports. With the correct level selected, you can choose to see data by #Actions or by #Opened Reports:
- # Actions – The number of actions performed by departments/users related to workspaces or reports.
- # Opened Reports – The distinct count of reports opened by departments/users.
(4) Workspaces/Reports
Shows the most important KPIs in a compact form with a hierarchy that allows navigation from workspace to report. The table is ready to export into Excel for further actions, if required:
- Current Period – Displays numbers for the selected period in the slicer.
- Delta – Shows the comparison between the selected period and the same number of days before. In the case of numbers, it shows the percentage difference, and for percentage values, it shows the difference in percentage points. See the example below:
| Today | Time selected | Current period from | Current period to | Previous period from | Previous period to | Delta |
| 5/20/2024 | Last 30 Days | 4/19/2024 | 5/19/2024 | 3/19/2024 | 4/18/2024 | (Current period – Previous period) / Previous period |
| 5/20/2024 | Last 90 Days | 2/19/2024 | 5/19/2024 | 11/20/2023 | 2/18/2024 | (Current period – Previous period) / Previous period |
Table 1: Example of Delta calculation
(5) # Opened Reports by Date
Shows the number of opened reports split by date. You can use the drilldown functionality to go from Year -> Month -> Day.
(6) # Opened Reports by Distribution Method and Activity by # Actions
Summarized visuals show the split of opened reports and actions, respectively.
Additionally, the “Activity by # Actions” visual has drillthrough functionality enabled. With a right-click on any activity bar, you can check the actual usernames, workspace, and report behind each activity.
Address Our Scenario
Step 1: Let’s Check the List of Active Users in the Marketing Department
The first thing I would do as Kate is to find out the list of Marketing department employees using Power BI content. This will help us understand who is using which reports across our company.
Let’s go to the filter and use a search box with the keyword “marketing”:
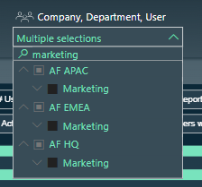
Picture 2: Filter by marketing department
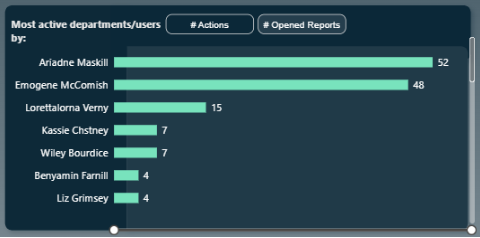
With this, we can see a list of active users in the graph on the right. It is possible to export it into Excel, so we can use the vlookup() function to compare it with any other list we get from the internal HR system. This way, Kate can cross-check if her list is valid or missing any of the names below:
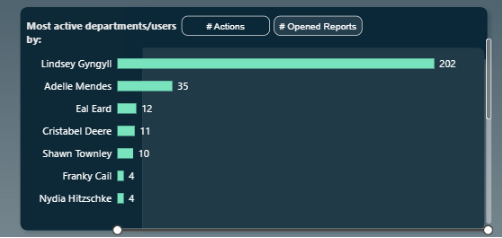
Picture 3: List of most active marketing department users by action
Also, with this department filter selected, we can review the “Most frequently used Workspaces/Reports by” visual to check what Power BI content is being used:
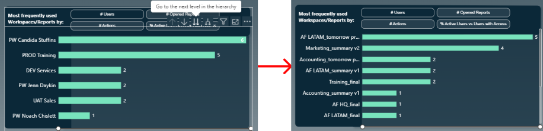
Picture 4: Content used by Marketing department
As you can see on that screen, Marketing employees are looking at various reports from various departments. This can be one of the main points for Kate’s further analysis. She should investigate what is required or important from a business perspective. Perhaps there is a way to consolidate some of the measures and provide sufficient information in Marketing-related reports.
Also, please note that the top workspace by the number of # Users is “PW Candida Stuffins.” PW stands for Personal Workspace. From a Power BI service health point of view, it might be worth reviewing this content and considering cooperation between the IT department responsible for Power BI reporting and Candida Stuffins.
Important: We are currently checking the active Marketing employees only. It might not be the full list of all Marketing employees, as the Tops page focuses on actions and activities. Let’s first talk with the people who are actively using Power BI. In the future, we could gather requirements from inactive users. In many scenarios, there are always some Excel or ad-hoc reports just waiting to be converted into company standard Power BI reports.
Step 2: Find All Users of Marketing Workspaces Content
Let’s filter the “Tops” page by DEV, UAT, and PROD Marketing-related workspaces. For this, we can use a search filter with the keyword “marketing.” As you can see in the screen below, even when filtered by “marketing,” we can see other workspaces as well. If we expand to a lower level, we can see Marketing-related reports in workspaces like Legal or Human Resources! This is one way to validate if our Power BI environment is clean.
For the purpose of this scenario, let’s assume we have Marketing-related reports only in Marketing workspaces. Here is the filter:
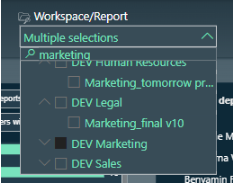
Picture 5: Workspace/report filter
Let’s check active users as per marketing workspaces:
Picture 6: List of most active marketing workspace users by action
As you can see, the above list shows entirely different names when filtered by workspace compared to when filtered by Marketing department.
This is definitely a reason for investigation. In a perfect world, the Marketing department and Marketing workspaces should have more or less similar user names:
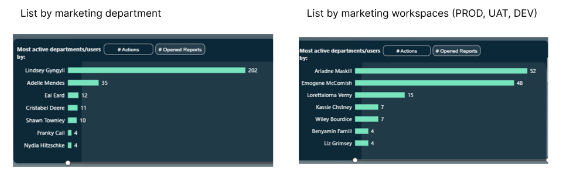
Picture 7: Comparison of users
Action for Kate: Investigate both lists and check why there are so many differences
Here, you can see the list of workspaces/reports selected by the filter. As you can see, reports from different departments are stored in UAT Marketing workspace!
What worries me is that PROD Marketing workspace is missing in the picture on the left (If there are no actions/users and so on, items on the axis are not visible by default). It means that currently, everyone is using only the UAT Marketing workspace! Another health check for our Power BI service team:
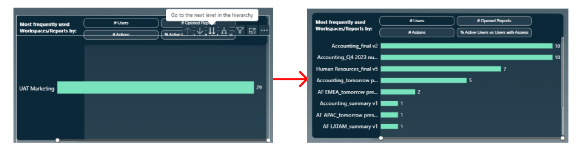
Picture 8: Marketing workspace vs report comparison
Step 3: Compare Marketing Employees List, Gather Requirements, and Build Power BI Marketing Reports Plus Workspace Cleaning Exercise
Now, Kate has all the information she needs:
- From step 1, we obtained a list of active Marketing employees.
- From step 2, we obtained a list of employees actively reviewing Marketing Power BI content.
Additionally, we can compare the above lists with the initial Marketing employees list from the assumptions to check for any gaps or missing names.
We also found out that report content might be mixed across different workspaces.
The next step might be to perform individual interviews, organize calls, and conduct workshops to address all the challenges and requirements across the Marketing content provided by Power BI service reports.
Sounds like a lot of work ahead!
Final Thoughts
Well, that’s it for today!
I hope you enjoyed our explanation!
With our tool and a few clicks here or there, we managed to:
- Understand which Marketing employees are active across the Power BI service.
- Understand which employees across the company are reviewing Marketing content provided in the Power BI service.
- Discover a couple of items that require our attention, such as most activities in the UAT workspace or the mess in reports stored across workspaces.
These findings open new opportunities and challenges, such as:
- Addressing potential security issues regarding who has access to which workspaces/reports, especially important with sensitive data such as Finance and HR.
- Cleaning and maintaining Power BI service health with proper report storage rules.
- Identifying any missing metrics in Marketing reports so that employees from that department don’t need to look elsewhere for the required information. This is a good opportunity to consider creating dashboards and apps that can consolidate information from multiple reports in one place.
- Cross-checking with different employees about their business requirements regarding Power BI service content.
In case of any questions, don’t hesitate to reach out to us! We are more than happy to discuss Power BI and our product in further detail!
- Magdalena Kulpa, our Master of Marketing: magdalena.kulpa@astralforest.com
- Michał Dębski, Co-Founder at Astral Forest: michal.debski@astralforest.com
- Michał Zalewski-Zięba, BI Consultant: michal.zalewski-zieba@astralforest.com
0 Comments