
Hello!
In today’s article I would like to talk about:
Power BI service cleanup and archiving unused reports based on PBI Monitoring tool.
Agenda
- Assumptions
- PBI Monitoring presentation
- Addressing our scenario
- Final thoughts
Assumptions
You are assigned to a position of Power BI service admin.
Your first task is to understand usage of Power BI reports across the company.
You have access to PBI Monitoring tool designed and implemented by Astral Forest.
You need to understand the number of “unused reports” across your company.
Define the KPI for “unused reports”.
If we find reports that have been unused for at least 180 days, these reports should be archived manually or using Astral Forest script. If using the script, selected reports can be moved to Blob storage on Azure Data Lake Storage (ADLS).
If we find reports with a very low number of actions, consider archiving them or checking with users to see if any improvements can be made. The overall goal is to reduce the number of reports.
PBI Monitoring presentation
To address the above case, we will use Power BI Monitoring tool, built by my company, Astral Forest.
Let’s focus on “Not used Reports” page.
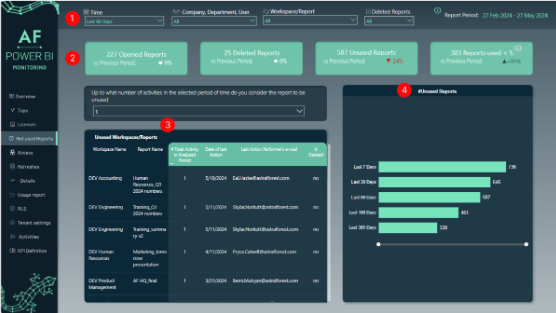
Picture 1: Not used reports PBI monitoring page
(1) Filters
At the top of the page you have several filters to select your data:
- Time – A slicer with relevant time periods based on today’s date and last “xx” days.
- Company, department, user – Detailed selection of your company structure, useful when you want to focus on a specific group of users.
- Workspace/Report – Allows tracking specific Power BI service objects and areas.
- Deleted Reports – A flag to indicate whether a report has already been deleted from Power BI service or not. This is useful for audit purposes.
(2) KPI’s
Regarding numbers, we focus on:
- Opened reports – Shows how many reports were opened based on selected filters.
- Deleted reports – Shows how many reports were deleted based on selected filters. If we select “Deleted reports” as “no”, the number will always be 0.
- Unused reports – Shows how many reports did not have any activity in selected filters. Filtering by company, department and user does not affect this KPI.
- Reports used < 5 – Shows how many reports had fewer than 5 actions performed by the user in selected filters. It is possible that the number of Opened reports is less than this measure because we include other report-related actions, like download report file.
(3) Filter with table below
This particular filter works only on the table below, showing reports where we had selected number of actions or fewer.
(4) #Unused reports
Shows the same information as KPI but in summarized form for each time period. There is also the possibility to drillthrough with a right-click to see actual reports behind the numbers.
Address our scenario
All right! Let’s address our use case.
Step 1
Let’s set up filters. We will focus on the last 180 days, all departments, personal workspaces only, and of course reports that are not deleted.
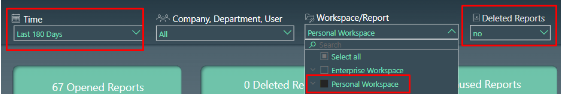
Picture 2: Setting up filters
Step 2
Now we need to define what “unused reports” mean. For this case, let’s assume that we want to see reports with no actions at all within specified filter context from step 1:
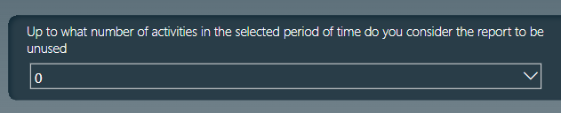
Picture 3: Unused reports
Step 3
Check reports stored in personal workspaces with 0 actions and export them to Excel for further actions:
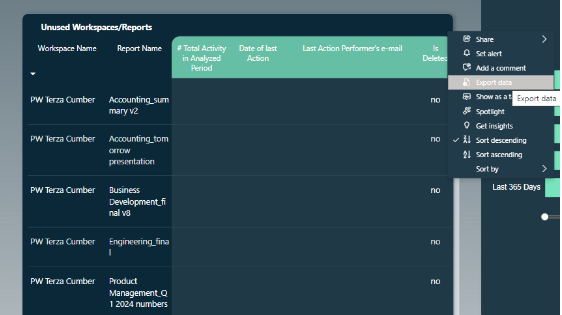
Picture 4: Personal workspaces reports with no actions in last 180 days
Each personal workspace has a name next to it, allowing us to easilytrack the owner of the workspace. We can now mail these owners with report names, asking them to archive the reports manually.
By archiving, in this case, I mean to manually moving reports from the Power BI service to a secured Sharepoint, for example. It’s good practice to keep old files, just in case we need to access them at some point in the future.
Step 4
A similar approach can be used for non-personal workspaces. In this case, let’s use the drillthrough functionality (right click on a specific bar within a chart) from the right visual:
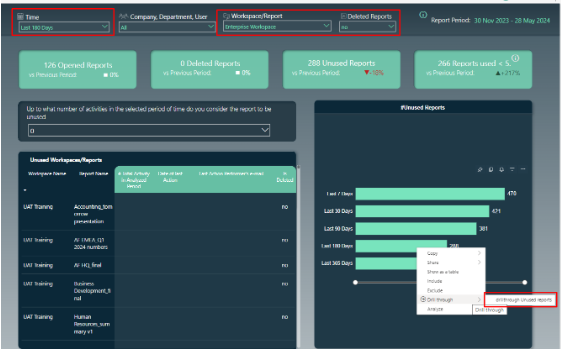
Picture 5: Drillthrough of unused reports
Drillthrough will navigate to a separate page showing data only for the filtered context from the previous page. Here, we have additional information, which could help us identify workspace owners:
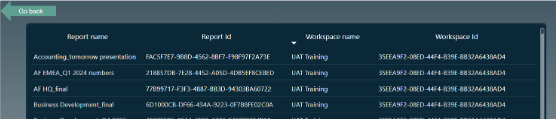
Picture 6: Drillthrough details
The IDs on the above page can be used when connecting to Power BI API for further actions.
Step 5
In an ideal world, each workspace should have an owner responsible for archiving unused reports.
However, in real-life scenarios, workspaces or reports are sometimes left without an owner, especially if a Power BI governance policy is not implemented within the company.
If we struggle to find owners and still decide to archive reports, we can use an automated solution with a script that moves certain reports into blob storage on Azure Data Lake Storage (ADLS). Here is the link to the full solution with code if you are interested.
Step 6
Now that we have cleansed the service from unused reports, the next step would be to consider reports with a low number of actions. In this case, we may switch the filter to, let’s say, 3 actions per report:
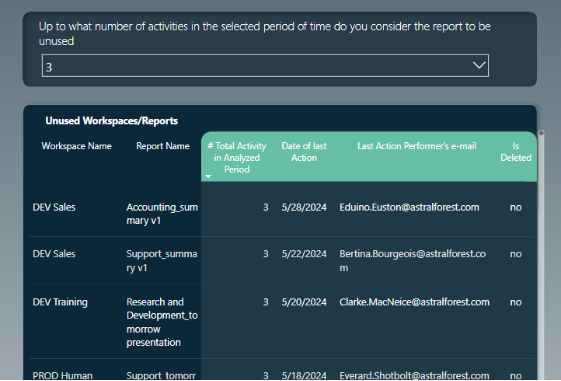
Picture 7: Reports with 3 actions or fewer
For these items we can consider a couple of actions, such as:
- Reaching out to the last action performer’s email to check what information is required from these reports. Maybe they can be grouped together to reduce clutter of low – used reports?
- Talking with the owners of these items to understand the goal behind creating these reports.
- Confirming if there are different sources with the same information, so these reports can be archived or updated.
- If there’s AAD group assigned to these reports/workspaces, we can talk with AAD group members to determine whether they are using the reports shared with them.
With the above information, we can start drawing roadmap and identify next steps/actions for proper Power BI service content governance.
Final thoughts
Let’s summarize why archiving is important:
Performance optimization:
- Reduced load on the Power BI workspaces, leading to faster performance of active reports.
- Organized workspace, making it easier to manage and find active reports.
Resource optimization:
- Freeing up resources for current, more critical tasks and reports.
Space management:
- Allocating more space for active reports. Both shared and premium capacity per workspace have limited space.
Data preservation and compliance:
- Archiving provides a historical record of reports and data, which might be useful in case of audits and compliance checks.
Collaboration and knowledge sharing:
- Archived reports can serve as a repository of organizational knowledge accessible for future reference and training.
- Teams can refer to archived reports to understand past decisions and outcomes.
Well, that’s it for today!
In case of any questions, don’t hesitate to reach out to us!
- Magdalena Kulpa, our Master of Marketing: magdalena.kulpa@astralforest.com
- Michał Dębski, Co-Founder at Astral Forest: michal.debski@astralforest.com
- Michał Zalewski-Zięba, BI Consultant: michal.zalewski-zieba@astralforest.com
0 Comments