
Tldr: the rapid growth in the popularity of Power BI is similar to the explosion of the automobile market. Just as cars (reports) alone were insufficient to serve society properly, the development of roads (infrastructure) and traffic codes (governance) was necessary to optimize modern transportation. In this article, we cover modern challenges contributing to the success of Power BI Adoption and the well-enforced Power BI Governance, with a focus on addressing them through the proper monitoring solution – “Power BI Monitoring”.
Agenda
Intro story – Power BI short story
- Power BI plays a significant role in the BI/Data landscape.
- Thanks to its vast community, working with PBI is both enjoyable and effective.
- Power BI has rapidly evolved from an excellent easy-to-use and quick-to-learn tool to an enterprise-level solution It can be successfully implemented as the main BI tool within large organizations (Fabric is following the same path).
- Currently, you can provide access to thousands of Power BI reports, dashboards, scorecards to thousands of users, enabling them to make data – driven decisions.
- Power BI has contributed to the faster delivery of BI Reports/ Insights by the central BI/Data Departments. It has also allowed citizen developers to shine. The extremely low entry-barrier and easy access to the knowledge about the tool have enabled the most tech-savvy and data-oriented business people to develop their own reports and share them with colleagues.
- Power BI has accelerated both the time-to-market for the centrally produced BI reports and the creation of reports by citizen developers. This has resulted in an abundance of reports and even more users, leading to new challenges.
Power BI challenges
As a result, new challenges have emerged:
Governance:
- Data quality and trustworthiness.
- Security.
- Data consistency.
- Cost-effectiveness -> elimination of the duplication.
Adoption
- Once the reports/Data Products are delivered, you want them to be used.
- Adoption does not simply mean opening the reports, but also knowing how to use them effectively to support the decision-making process.
Wise spending:
- If you build a new report, you should have some assumptions about what group of people is going to use it. Then, once the report is delivered, you can learn if the assumptions were right. This way, you can better direct your future investment.
Measure of success:
- Need to understand, measure and check business impact, user adoption, ROI, life span of the report.
- Requirement to address and prove success to stakeholders.
Overall, it resembles the times when cars were becoming a commodity. With vehicles more common and increasingly faster, we needed more efficient infrastructure and regulations for the system to thrive.
- Infrastructure: The network of roads, petrol stations, roundabouts etc. In the case of Power BI, it’s mainly the underlying data layer and/or Power BI/Fabric Capacities.
- Governance: The traffic rules to follow, so everyone can move quickly and securely, and finally the rules for when a car should be scrapped as it is too obsolete or dangerous to drive safely. The same applies to Power BI Reports you need to establish the rules explaining the conditions when report should be available to the public, to which public and when it should be scrapped (report lifecycle management). The outdated reports lead to confusion and are dangerous for the business making process.
Increased literacy:
- Basic car – literacy – enough information for a typical driver to drive safely.
- Super users – car mechanics, able to provide the needed maintenance for cars to run.
Proper workspace management:
- Unsupervised (almost) Personal workspaces, where single user can do anything in an unsupervised and uncontrolled environment, however you should make sure that:
- The report share in personal workspace is not consumed regularly by more than XXX people in your organization .
- Well – organized workspaces with security: Enterprise/company workspaces managed and secured by IT department, keeping all data safe, ensuring good practices and proper versioning with clean environment.
What’s often happening is the growth of the organization and its appetite for data outgrowing the Governance efforts. It’s not uncommon for the organizations to end up with thousands of reports containing many redundancies, dubious data quality and security risks. Especially if you don’t track how many new reports are created each month, their usage and who has access to them. It’s like driving far too many cars without technical inspections, speed limits and other traffic rules on the country road by the people having no driving license. Not the best organization.
The need to have the solution allowing to:
How to get out of this situation or prevent it from happening? You need to know what exactly you are dealing with. Those kinds of questions should help you get there:
- How many reports you have?
- Who uses them?
- Who has access to them?
- How is the access organized?
- Who your Super Users are?
- How many activities and reports are stored on personal workspaces vs company workspaces managed by IT or Super Users?
This information helps you not only to better manage your PBI setup but also to drive your BI/Data strategy more efficiently. It allows you to focus on the items that bring the most value to your organization.
How to get there? The truth is that the initially provided tools are not good enough.
As for now, the best method available in Power BI without any additional setup is the usage metrics Dashboard in PBI Tenant settings:
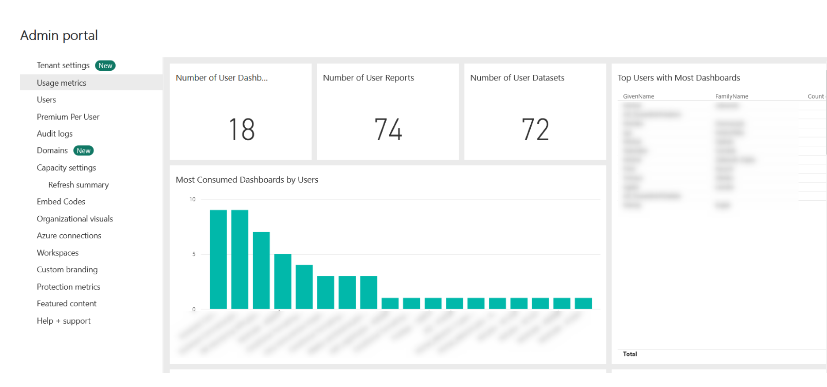
Usage Metrics Report:
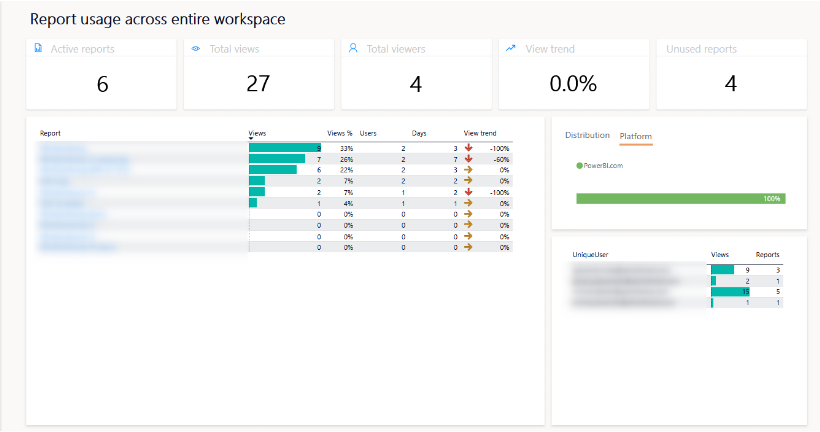
Although you can obtain some basic information from these tools, you cannot:
- Track results over longer time periods.
- Easily define the top users across all workspaces or the most frequently consulted reports.
- Verify user access.
- Check who’s creating the reports.
Not to mention, you don’t have easy access to the data through the SQL queries. A small and compact Datawarehouse for your BI activities would be nice, wouldn’t it? You could surely use nicely setup fact tables about:
- Users’ activities (viewing, creating, editing reports and other PBI objects, identifying unused objects).
- Relations between the objects (listing all reports impacted by a given data source).
- Semantic model refresh times (how much of the underlying data layer is used).
- Access – easily checking which reports a particular uses has access to, and vice versa: listing all the users having access to a particular report.
Our solution – data source
The question is: how can you achieve all of the above? Fortunately, this is the moment where Power BI REST API comes in very handy.
The idea behind the solution is as follows:
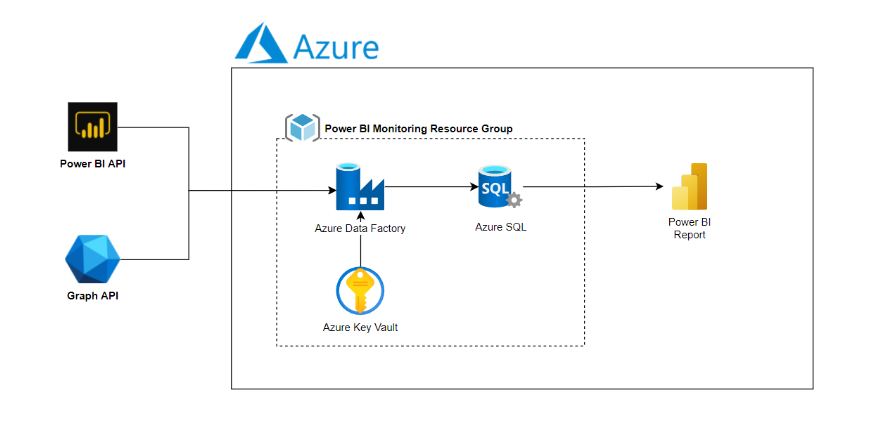
You have 2 main data sources:
- Power BI REST API: From this source you can get all the information regarding Power BI Objects’ usage, semantic models refresh, access, RLS together with Power BI metadata.
- Graph API: From this source you can get all the information about:
- Users’ licenses – Power BI Pro and Power BI Premium Per User.
- Users’ adherence to Microsoft Entra ID group (old Azure Active Directory).
The data acquisition and orchestration is managed by Azure Data Factory.
Within a small Azure SQL DB you can find:
- Stored procedures containing all the logic needed to transform JSON-like data acquired from Power BI REST API into Star Schema.
- Medallion Architecture with bronze, silver and gold layers.
- Gold Layer containing the fact and dimension tables loaded into Power BI Semantic Model.
Our solution – Power BI report
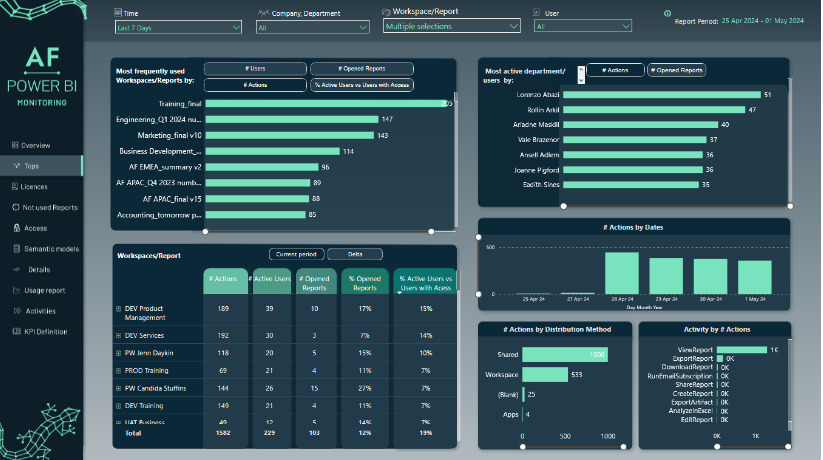
Power BI Report is the primary tool that helps you gain a better understanding of what’s happening within your Power BI Tenant. Power BI Monitoring provides deep insights and control over your Power BI environment. It allows you to manage and optimize your Power BI usage, improve governance, and enhance overall efficiency. Let’s take a look at some features of Power BI Monitoring:
- General Overview of your Power BI Solution
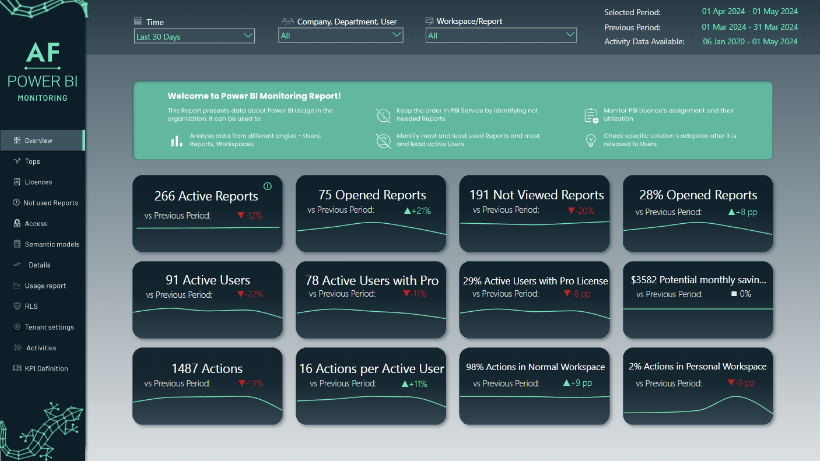
Get the quick information about:
- The current number of reports in your organization compared to the past.
- This information is important for your Adoption metrics, as well as the number of Actions per Active users. The percentage of Actions in “Normal Workspace” vs “Personal Workspace” often can be used as a measure of the degree of “ungoverned self-service” usage of Power BI.
Overview of your Reports and Semantic Models:
- Get a detailed list of all reports and semantic models in your tenant.
- Identify the top-used Power BI reports based on the number of actions or users.
- Determine the business owners of reports and ensure their proper identification.
Monitor Usage and Trends:
- Identify rarely used or unused reports for potential cleanup.
- Analyze the trends of Power BI adoption in your organization to see how usage evolves over time.
- Track usage in different workspaces (normal vs. personal) to understand ungoverned self-service.
Governance and Access Control:
- Determine whether reports are primarily shared at the workspace, app, or report level to assess governance maturity. Monitor who has access to specific reports and how they are utilizing them.
- Identify users with licenses but low usage rates and adjust licensing as necessary.
Manage Workspaces and Reports:
- Identify workspaces that require cleanup due to unused reports.
- Redesign your access policy to limit access to active users and promote top creators/editors.
- Identify reports from personal workspaces that should be migrated to central workspaces based on usage.
- Identify Power BI Service objects that are not adhering to the naming conventions.
Monitor and Address Security Concerns:
- Check the most downloaded reports to verify there are no security breaches.
- Monitor reports with excessive access permissions and ensure security compliance.
- Verify RLS (Row Level Security) application and role definitions.
Handle Semantic Models and Dataflows:
- Monitor time-consuming semantic models or dataflows during refresh processes.
- React promptly to failed refreshes and address issues in semantic models.
Enforce Cleaning Policies:
- Generate reports for archiving based on low activity levels and enforce your cleaning policy.
- Identify and enforce cleanup within personal workspaces according to organization rules.
Access and Permissions Management:
- Verify the reports available to a specific user and how they can access them their access permissions.
- Ensure proper access permissions and track actual usage by each user.
Manage your Data Strategy:
- Identify the top 20% most frequently used your data assets.
- Promote data-proven good practices.
- Calculate ROI of your Power BI Reports.
- Negotiate with your stakeholders based on the usage data of your reports.
Final thoughts
Power BI Monitoring provides you with a holistic view of your Power BI environment, enabling strategic actions to improve governance, enhance performance, and ensure security and compliance. By leveraging these features, you can optimize your Power BI usage and promote a culture of efficiency and data-driven decision-making within your organization.
There are 3 ways you can equip yourself with such a solution:
- You can build it from scratch completely on your own.
- You can use the freely available community edition accessible from this GitHub Repo.
- You can contact us via the email addresses below to deploy Power BI Monitoring Premium edition in your Power BI Tenant:
- Having all the necessary access, the solution is deployed within one day.
Contact list:
- Magdalena Kulpa, our Master of Marketing: magdalena.kulpa@astralforest.com
- Michał Dębski, Co-Founder at Astral Forest: michal.debski@astralforest.com
- Michał Zalewski-Zięba, BI Consultant: michal.zalewski-zieba@astralforest.com
Thanks for reading and good luck with Power BI Monitoring!
0 Comments