Case Studies

%402x.svg)

Data/BI platform migration is a thing that strikes fear into the hearts of people. The financial staff is afraid of the costs, technical teams are worried about the workload, and users don’t want to go through the adaptation process. As a person responsible for quite a few of them, I can sympathize with all of you.
But trust me, it doesn’t have to be that terrifying once you consider the potential outcome, the long-lasting optimization, vastly improved performance, risk mitigation, savings, and the access to more specialists. Ultimately, all parties involved profit from the migration, and they quickly forget about all the hassle.
So, let’s discuss the complex challenge of BI/data platform migration. In the next few paragraphs, I’ll try to make the entire subject much more approachable. You’ll learn about the general due process of BI/Data platform migration, but I’ll also add a real-life example to every phase to showcase how it works in action.
Starting a conversation about data migration is often the most difficult part. It’s never easy to say goodbye to something that has been a part of our business for years, especially if we know how challenging the migration will be for the entire company.
Even if everyone realizes it hasn’t been all that great for a few years now and that the system has serious stability and performance issues, it’s still that thing everyone in the company knows. So there will always be resistance.
In addition, it’s quite common that no one in the entire organization actually knows how it was built. The system just works without anyone knowing how. There’s not even a list of tools and systems that are dependent on or somehow intertwined with it. And the only person who has the answers left the company 12 years ago without leaving any documentation.
Unfortunately, this approach to the problem can be dangerous. Faulty, outdated systems tend to generate massive costs and pose risks. They’re slow, unreliable, and often on the verge of obsolescence. They endanger the company’s security and limit scalability potential. And those are just the general issues that apply to almost every situation.
So, how do companies start talking about migration?
From my experience, there are a few common scenarios.
Usually, it’s a person with experience in BI, data operations, or system migration who investigates the situation and determines that a migration is necessary.
They have the essential knowledge and expertise to explain the risks and potential gains to the board. In their career, they’ve seen (or heard of) similar issues, they understand the importance of data and BI, and they’ve talked to people who had experience with similar migrations. Generally, they know the risks and issues that come with the new system, and they have a strong motivation to change it.
This is perhaps the most common scenario.
System migration is often one of the requirements set by an investor who has audited an organization. An experienced external team hired by an investor can easily pinpoint major issues and recommend migration to ensure a company will maintain growth.
Some systems simply must retire and it’s often due to the end of manufacturer’s support. Unsupported and outdated hardware creates serious security and disaster recovery risks, so it’s often age alone that forces a company to move forward and migrate.
Common examples of such systems are: Microsoft SQL Server, Business Objects, Cognos, and MicroStrategy (older editions).
Besides those two, there could be any number of reasons that finally motivate a company to undergo system migration. A metaphorical “fire” in the organization could be caused by some system failure, or a literal fire could burn the computer room. Any guess is good at this point.
In the case I’ll discuss, system migration was motivated by a combination of 1. and 3.
There was a new change advocate in the organization, but there was also a very old set of systems. The software hadn’t been updated for a few years, and the hardware was set to lose support in the next nine months. The migration was simply a do-or-die scenario.
Any project like this always starts with a broad investigation. We must learn about all the business processes, stakeholders, software solutions in place, dependent systems, hardware, data sources, and other relevant elements of the enterprise ecosystem.
Here are some of the most significant questions we need to ask:
This part of the process should be finished with a report summarizing the situation and listing the next steps. It can include details about the technology we’ll migrate towards and the necessary tools.
Case: SQL Server 2008 Migration to Synapse, Azure Analysis Services and Power BI
Our client was a mid-size retail company that hired several thousand people and operated in an omnichannel model. It consisted of brick-and-mortar stores, a webshop, and a marketplace.
In our client’s case, we were dealing with two major data warehouses and two reporting tools:
Generally, if you see 2008 in the name of your software or hardware, it’s fair to say that you’re in trouble. So, to put it simply, we had to migrate the on-premise BI Solution to Azure.
The solution in place was ancient. It consisted of:
To make things worse, there was no documentation or information about the user base. As an interesting footnote, we were informed that the hardware we were supposed to migrate from survived a computer room fire at some point.
Once we understand what we’re dealing with on the surface, it’s time to dive deep into the system and figure out where the data comes from and how it is used. The most important goal of this process is to determine what exactly needs to be migrated and what can be dumped.
You can think of it as a literal moving. It’s like you’ve lived in the same apartment for ten years and finally decided to move to a beautiful new house. Over that decade, you’ve collected loads of stuff you absolutely don’t need. Some things are broken, others you simply don’t need anymore. So it’s a perfect opportunity to get rid of them.
This process is essential in the case of a BI/data platform relocation. While we’re at it, we can eliminate or archive each unnecessary report, which means massive savings and a vast improvement in efficiency. You should always operate following the formula: plan and execute. The goal of the analysis is to prepare the plan ready for the execution.
So, our job is to determine exactly which reports are needed and which can be removed or archived. You should also verify what else is to be migrated in addition to the reports. There are a few ways to do this. To get the most accurate picture, we’ll use all the possible methods, at least to some extent. It involves a combination of database analysis, user behavior analysis, SSRS logs analysis, and many stakeholder discussions.
The initial part of the work (system and logs analysis) can be done without much involvement from the organization, but at later stages, the migration team always needs to investigate every relevant department. Again, it’s fair to say that we play the role of a moving company. While we’re packing stuff, we need to ask each and every family member what belongs to whom, what’s required, and what can be dumped.
To be a little more specific, we need to find reports that are still used and assign them owners in the organization, which can be trickier than it sounds. In many cases, we must negotiate with multiple stakeholders to ensure that all reports have someone responsible for them. The owner will make the key decisions on what will happen with the report as we move forward. Usually, we recommend assigning 1-2 owners per business domain (e.g., sales, marketing, logistics) to streamline communication.
The final goal at this stage is to form a complete list of reports that are actually needed. Once we have the list, we can proceed to estimate how much effort will be needed for the migration project. Usually, we evaluate reports by t-shirt sizes: XS, S, M, L, and XL.
The important positive side-effect of the process is the education of the entire company, and the support and involvement of the upper management is crucial. By assigning owners, we’re highlighting the importance of BI as a whole. It’s another key moment in raising organizational awareness about data as a subject. On top of that, we’re establishing a process-based approach to data operations. We’re creating a system that will be manageable and scalable for years to come.
Finally, it’s worth reminding that the essence of such a migration is not just transitioning from old technology to the other. We’re building a new system that needs to work for the people and the company as a whole. We’re not trying to recreate the old structure; we’re focusing on the system’s purpose.
Case: SQL Server 2008 Migration to Synapse, Azure Analysis Services and Power BI
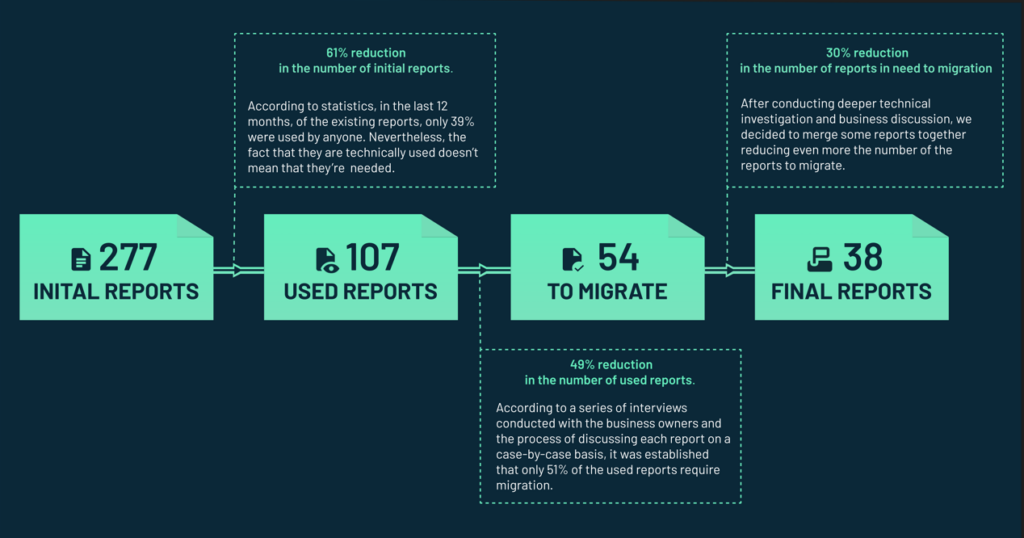
During the initial assessment of our client’s situation, we established that 277 reports existed, but only 107 were used in the last 12 months, according to the stats. But just because the 107 reports are technically used doesn’t mean that they’re needed. Or at least they might not be needed in their entirety.
That’s why we created a spreadsheet with all the used reports and key information about them, including links, queries, types, date of last use, most frequent users, and more.
* It’s rough estimate, the data needs to be analyzed carefully to define if there are missing elements or not.
With a list of used reports, we start assigning business owners for each report. In order to identify the business owners it comes handy to use the information about the most frequent user of a given report or about the last user of the given report. During the process, we discuss each report on a case-by-case basis to establish whether it’s actually needed. At this point, we can also determine if it’s possible to merge reports using the capabilities of the Power BI instead of relying on SQL Server Reporting Services. That way, we can archive even more reports, making the process (and the new system) much more efficient.
Then, we downloaded the SQL Query lists for all of the 107 reports to discover which elements and columns are actually used in each report. This led us to a report-table-column mapping for all 107 reports. Then, using Power BI, we were able to find out how the reports are built and what it will take to migrate them:
Once you have this information, you can move to the first t-shirt size evaluation phase and so you ’re finally able to roughly estimate the duration of the entire project, noting that it will most likely change quite a bit in the next stage, which is investigating and assigning owners.
Initially, we’ve discovered that there were 277 initial reports in SSRS, but only 107 of them are used by anyone. After a series of interviews with business owners, we established that only 54 out of all 107 reports used need to be migrated. For those 54, we assigned priority levels and identified any potential low-hanging fruits: easy-to-migrate reports that we can process in the first place. In addition to that, we’ve realized that some of the reports can be merged and a few more have low priority and can be migrated at a further date.
The final number of reports after the merger was set at just 38, so we reduced the number of reports by 239.
This rough estimate should give you an idea of what effort is needed to continue the adventure.
The process up to this point went fairly well, so it was only natural that we had to run into trouble at some point.
The first issue was caused by the lack of documentation for the Synapse data warehouse on Azure, so we had to manually map all the missing data, adding a few weeks of work.
However, the next bump in the road was much more worrisome. We realized that business users had access to the on-premises data warehouse and could freely run open queries to the ERP, which was a massive security risk. It also meant that we need to plan on an alternative way for them to get access to the data.
During the analysis, we also realized that we needed to add a few additional tasks to the list and consider them in the final evaluation:
Finally, we were ready to prepare the final document that concluded the analysis and listed all the key elements and phases of the migration.
After 64 man-days of thoroughly analyzing the entire system, we created a plan that specified the necessary steps and processes to complete the migration. At this point, we were ready to provide a more accurate estimate. However, in those types of massive data migrations, working in a fixed-price model is impossible.
The roadmap for the project included:
In the end, we ended up with 54 reports to migrate. Due to their high similarity, we merged several of them to reduce the overall number to just business- critical 38 reports.
In the last part of the story, we’ll have to move away from the current format. The actual migration part is so unique and entirely dependent on the previous two phases that it’s virtually impossible to provide any general advice.
That’s why we won’t make such an attempt, and we’ll simply move on to the case study.
Case: The entire migration phase was based on two key principles that defined how we worked.
First was the focus on the ever-present optimization based on workshops and continuous discussions with business users. Throughout the process, users come up with many different ideas that can often change the scope and force changes on the reports we’re migrating. We need to be dynamic and adjust our processes accordingly, especially if the proposed changes can improve the system by making it more efficient. Nothing is set in stone.
Second, we work in the Kanban methodology. Due to the high unpredictability, it’s not recommended to work in a classic agile or waterfall model. We work on the never-changing premise that there are a lot of potential unknowns that can change the course of action. Kanban gives us the much-needed flexibility to work around the obstacles.
The process itself started by confirming business owners for the last time. Each of them had a massively important role to play in the next few months, so we needed to have them locked in.
Then, we proceed to the exact data mapping between the on-prem data warehouse and Azure. Shortly after, we created the ETL (Extract, Transform, Load) cleaning framework and began to add new data to the Azure warehouse. With this tool ready, we were ready to prepare the data layer needed to migrate reports.
Simultaneously, we started delivering the least complex reports (the ones based on the already existing data and simple logic (“XS” and “S” sizes). Those were the low-hanging fruits that we wanted to do at first. Once we had the first reports in the new BI platform, we could introduce the first business owners into the testing process. That way, we made the entire process more efficient and instantly showed results to the organization.
It was particularly important because it was the company’s third attempt at migration. Many team members were a bit skeptical, so showing quick results gave them a much-needed confidence boost. The Kanban model plays a huge role in that. All business owners are constantly updated about the status of each report and know what is expected of them. They know what data is still missing and who is responsible for the job.
After the “low-hanging fruit” stage, we continued migrating all the remaining reports following the same procedure. It was by far the most time-consuming part of the project and involved a lot of further negotiations, but it went relatively smoothly thanks to a well-established process.
Throughout the process, we conducted regular stand-up-style meetings and updates to ensure business logic and format of each report. During those meetings, we would also stumble upon ideas on new reports to add to the backlog. The migration part of the job was based on the 1 report = 1 developer = 1 Business Owner rule to ensure ownership and efficiency.
The next key part was the configuration of subscriptions and data sharing with external users. We needed to ensure that everyone who was supposed to get something from the data warehouse would still get it in the new system.
After we’ve dealt with the most important part of the job (report migration), we started working on the two extra pieces that we’ve learned about during the assessment:
Technically, they weren’t in the initial scope of the data platform migration, but they were indeed operating using the old machine, so they had to be included in the process.
Handling those tasks was particularly challenging because no one in the organization was directly responsible for either the website or the app. On top of that, those are the types of tasks that require a different set of skills than the data platform migration itself, so they often require additional recruitment.
The app was quite an old piece of software created without any standards and using a bizarre mix of technologies with no documentation. Still, we needed to ensure that it would work properly after the migration. In the end, we managed to persuade the IT team to take responsibility for it. We’ve done pretty much the same with the website.
We also stumbled upon one additional, completely unexpected task when we discovered that the marketing team requires significantly more access than we expected. In fact, it was a bit too much from a security standpoint – they were allowed to update all the tables in the SQL Server. Therefore, we had to create a new way for the marketing to upload and transfer data that allowed them to do their job while not posing a risk to the system.
As we were finishing the migration process, we started an additional follow-up project of creating DataMart on Azure. It was a necessary tool for the supply chain team that required quite extensive access to data. Initially, we gave the team access to raw data, but a secure, long-term solution was needed. That’s why we had to create DataMart.
It was one of the last tasks in the project, but it was one of the most time-consuming as it took 580 MD. The process involved:
After we created DataMart, we migrated a few last reports that were initially assigned at low priority and were not needed to sustain the operations of the company.
Finally, we took everyone’s access to the on-prem data warehouse and turned off the machine.
As a humorous sidenote, we discovered after turning off the old hardware that someone in the company, without anyone realizing it, was using it as a form of a Dropbox. Fortunately, none of the files posted there were of any real significance 😉
Other than that, the migration ended successfully.